
The oscillation of a body on a smooth horizontal surface is represented by the equation $x = A \cos \omega t$,where $x$ is the displacement at time $t$ and $\omega$ is the angular frequency of oscillation. Which one of the following graphs correctly shows the variation of acceleration $a$ with time $t$?
- A
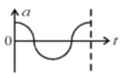
- B
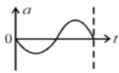
- C
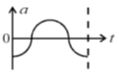
- D
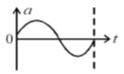
Explore More
Similar Questions
Give the direction of velocity and acceleration of an $SHM$ particle.
Easy
View Solution$A$ particle of mass $5 \,g$ is executing $S.H.M.$ with an amplitude $0.3 \,m$ and period $\frac{\pi}{5} \,s$. The maximum value of the force acting on the particle is (in $\,N$)
$A$ small wooden cube is placed on a plank. The plank performs a vertical $S$.$H$.$M$. of frequency $\frac{3}{\pi} \text{ Hz}$. The maximum amplitude of the plank so that the wooden block does not leave the plank is [take $g = 10 \text{ m/s}^2$].
DifficultMHT CET 2022
View SolutionWhat is the phase difference between the displacement and acceleration of a particle executing $SHM$?
Easy
View SolutionThe displacement of a particle performing $S.H.M.$ is given by $x=5 \sin (3 t+3)$,where $x$ is in $cm$ and $t$ is in $s$. The maximum acceleration of the particle will be (in $cm \ s^{-2}$)
Vedclass Products
For Students
Vedclass Test Series
Mock tests in real JEE/NEET style with performance analysis. 5-day free trial.
Start Free TrialFor Teachers
Exam Paper Generator
Generate Set A/B/C/D exam papers from 7.5L+ questions in 2 minutes. 3 chapters free.
Try FreeFor Institutes
Online Exam Module
Live online exams with unlimited students, 360° analytics & white-label branding.
See Demo